Fastly’s edge cloud platform serves over 10% of internet requests, and we power tens of thousands of online destinations — including leading retailers like Nordstromrack.com | Hautelook, Airbnb, Dollar Shave Club, ModCloth, and Ticketmaster. As a result, we have a unique view of how shoppers are engaging with ecommerce sites this holiday season.
US “Black Friday” deals (and shopper engagement) extend beyond Friday — online deals are considered best on Thanksgiving Day, while Cyber Monday 2017 was the biggest yet, bringing in $6.59 billion in online sales — compared to $5.03 billion on Black Friday, and 16.8% more revenue than Cyber Monday last year. And, this Cyber Monday was the first $2 billion mobile shopping day. Similar to our observations last year, we saw significant increases in traffic to ecommerce sites during the week of Thanksgiving, with traffic climbing to 152% above average the morning of Cyber Monday.
We also took a look at how people prepped for the holiday — looking up recipes on food sites, checking the latest sports news — and altruistic engagement on Giving Tuesday. Read on to see what we learned.
Note: We’re not comparing this holiday traffic from this year to last; because we’re always adding new customers and new traffic, it wouldn’t be an accurate comparison. We analyzed traffic throughout the holiday week, starting at midnight on 11/20 and ending at 11 PM on 11/28. We selected the baseline for seven weeks prior: 10/2, starting at midnight, to 10/10, ending at 11 PM. All times are in Pacific Standard Time.
Here’s a breakdown of how people engaged this holiday season.
Shopping during Cyber Week
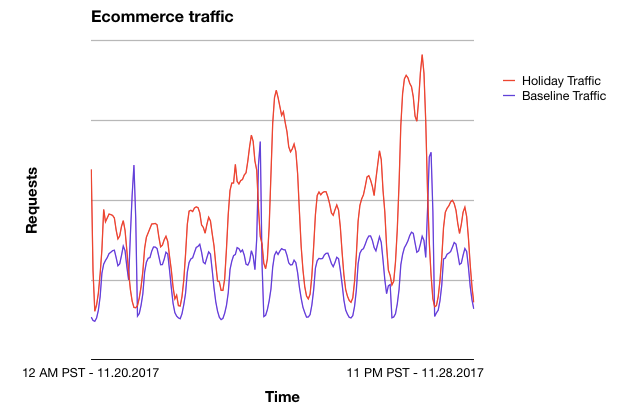
The period from Thanksgiving through Cyber Monday accounts for almost 20% of all online shopping in the United States. Sales (and engagement) were sustained throughout, making it more of a Cyber Week. And, Black Friday sales are beginning earlier and earlier each year. We saw corresponding engagement online: this year, we saw elevated traffic as early as 7 AM on 11/20 – traffic was 57% higher than the same time seven weeks prior. Similar to last year, we saw more engagement on Cyber Monday than Black Friday — traffic was 41% higher at 6 PM on Cyber Monday, as compared to the same time on Black Friday.
The following graph shows that the traffic spikes throughout the holiday week are both higher and more sustained as compared to normal, although the patterns still match the diurnal shopping habits from the previous month (i.e., people don’t shop when they’re sleeping).

Thanksgiving: starting early
Shoppers started early this year — as of noon on Thanksgiving Day, traffic was 66% higher than average. It quickly jumped again to 120% higher than normal around 8 PM.
Black Friday: expected engagement
As expected, there was increased engagement with ecommerce sites throughout Black Friday — at 5 AM PT on 11/24, traffic was 161% higher than normal, and remained high, at 125% above baseline at noon. Traffic was still up 113% at 8 PM, but began to taper off slightly into the evening.
Small Business Saturday: shopping locally
Shoppers tended to engage slightly less the Saturday following Thanksgiving, as compared to the first two days, with traffic 57% above baseline at noon on 11/25. Not only is Small Business Saturday a relatively new concept, but the emphasis is on local businesses who may have less of an online presence, explaining why we’d see fewer spikes.
Sunday: taking a break
Shoppers took a break on Sunday, although traffic was still 49% higher than normal at noon on 11/26.
Cyber Monday: the highest engagement
The biggest deals were in full swing on 11/27, and shopper engagement matched: traffic was 152% higher than normal at 7 AM, 113% at noon, and was 148% higher at 5 PM PT.
Giving Tuesday: giving back
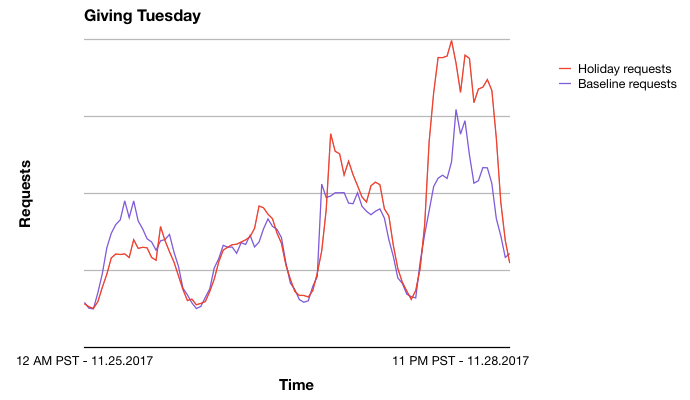
In the wake of last year’s presidential election, we saw that the Tuesday following Thanksgiving produced record spikes in donations. This year, we saw a spike on 11/21 at 3 PM, when giving traffic rose 60% above baseline. By 7 AM on Giving Tuesday, traffic once again rose 71% above baseline traffic as people logged on and donated to causes like the ACLU, Direct Relief, and One America Harvey Appeal.

Last-minute recipes + football
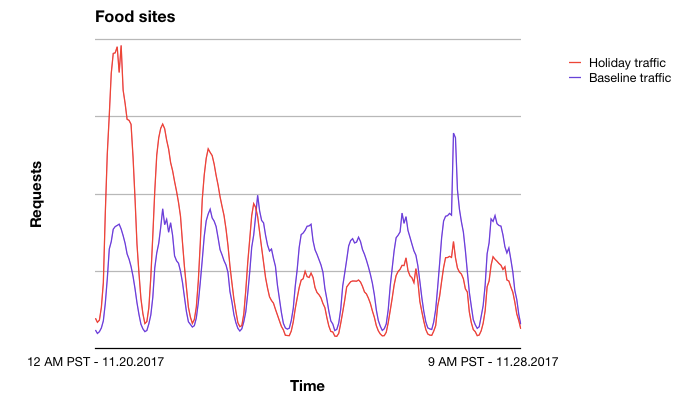
Our real-time insights revealed that there were more than a few Thanksgiving meal procrastinators — traffic to food-related sites surged 201% at 5 AM three days before Thanksgiving, and was still high — at 68% above normal — on 11/21 at 6 AM as people searched last-minute recipes. After the meal concluded, however, traffic quickly dropped, to 52% lower than average at 7 PM on 11/23, and remained 30-40% lower than normal though 11/28, as satisfied (and overstuffed) people gave food sites a break.

There were three football games on Thanksgiving Day this year. As a result, we saw increased engagement with sports news websites as compared to a normal Thursday. Traffic to sports-related news sites was up 149% as of 1 PM, and remained high (111% above average) until around 4 PM, dropping to 16% below average around 6 PM as people returned to their families.

In our next real-time insights, we’ll share major moments of engagement from 2017. Stay tuned!
