Profiling Fastly Compute Applications

Architecte principal des solutions, Fastly
As a member of the Fastly Solutions Engineering team, I care deeply about web performance. I work with our customers to configure their services and use Fastly features to make their web applications fast. While I generally use browser developer tools to investigate performance, how can we investigate performance on Fastly Compute, our serverless platform that lets you easily build the best experiences for your users?
Fastly Compute is an advanced edge computing system that runs your code, in your favorite language, on our global edge network. Security and portability are provided by compiling your code to WebAssembly (Wasm), a portable compilation target for programming languages. We run your code using Wasmtime, a fast and secure runtime for WebAssembly from the Bytecode Alliance project.
Setting up the environment
Let’s step through an example. Fastly Compute provides language tooling for JavaScript, Go, and Rust. I wrote a Rust application using the Fastly Rust SDK that generates a picture of a part of the Julia set, a mathematical function that can be quite pretty:

To run this on Fastly Compute, the Fastly CLI invokes the Rust compiler to compile the Rust code to the Wasm platform rather than my laptop’s platform.
To run this on your laptop, use:fastly compute serve.
Generating these pretty images takes a few hundred milliseconds — that seems a little slow. How can I find out what is the slow part? The engineer’s tool of choice is a profiler. I could separate the Rust code out and use Rust’s standard profiling tools. However, the performance on my laptop’s platform might not represent the performance on Wasm.
Capturing performance data
It’s best to profile applications in a way that is as similar to production as possible, so we’ll use the cross-platform Wasmtime guest profiler. The “guest” part of the name indicates that it is profiles inside the Wasm process. To serve and profile from your laptop, use
fastly compute serve --profile-guest Every 50 microseconds Compute notes down the function call stack (that is, which function are we in and which function called it), and then after the HTTP response is sent, it writes the captured profile to a file. The file is in a format supported by the Firefox profiler. Captured profiles can be viewed by dragging and dropping them onto https://profiler.firefox.com/, which processes the profiles using your browser.
Analyzing profiler output
The initial view from the Firefox profiler shows a number of tabs and the call tree, which is split up by function names. Some of these are from the Rust runtime, from my application, and from libraries that my application uses.
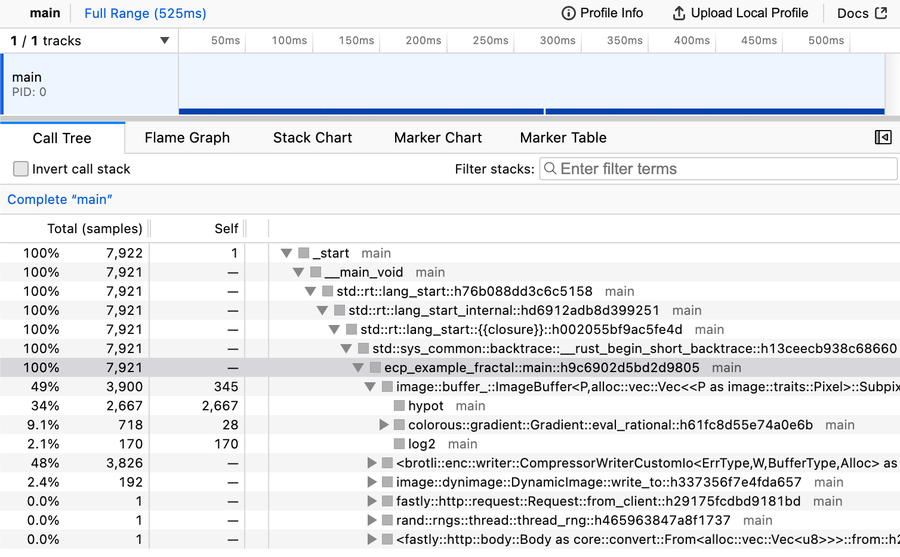
The guest profiler took 7,922 samples. The entry point of my application is the highlighted ecp_example_fractal::main function and 100% of the samples had it in the function call stack, as indicated by the Total (samples) column. However, the Self column indicates that none of the samples were in the main function itself: all of the work is being done in other functions.
The key parts of the application are:
image::buffer_::ImageBuffer::from_fn(), a Rust image library, which runs a function for every pixel. The function took 345 sampling intervals, while the call stack originating from this function took 3900 sampling intervals.colorous::gradient::Gradient::eval_rational, a Rust color scheme library, which assigns a nice color to each pixelbrotli::enc::writer::CompressorWriterCustomIo, a Rust library to compress the response using Brotliimage::dynimage::DynamicImage::write_to, the same Rust image library which encodes the image using the PNG format
Another way of visualizing the Self count is the flame graph tab:
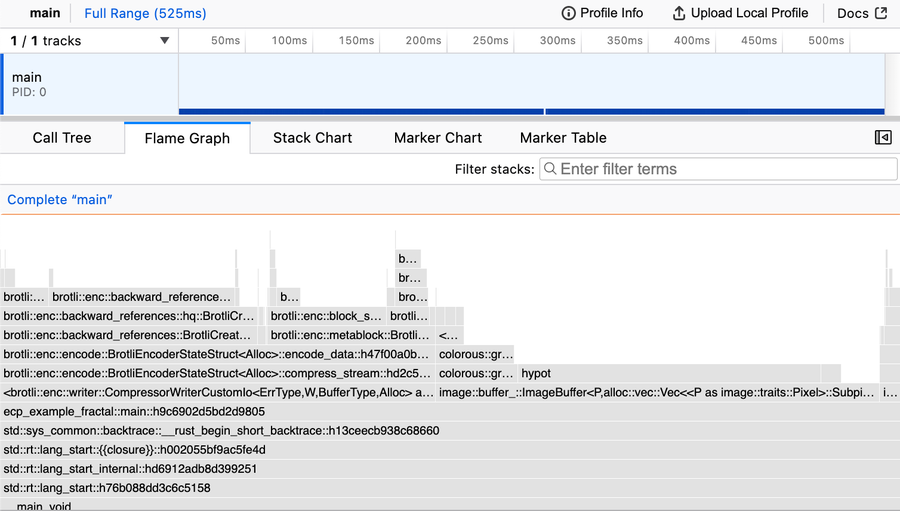
This is a good way of seeing the relative amount of time being spent on these functions. By seeing what stacks are above the main function, we can see that the application spends most of its time generating the image (the image:: stacks), picking the pretty colors (the colorous:: stacks), and compressing the image as Brotli (the brotli:: stacks).
One more way of visualizing what functions are on the call stack is the stack chart tab:
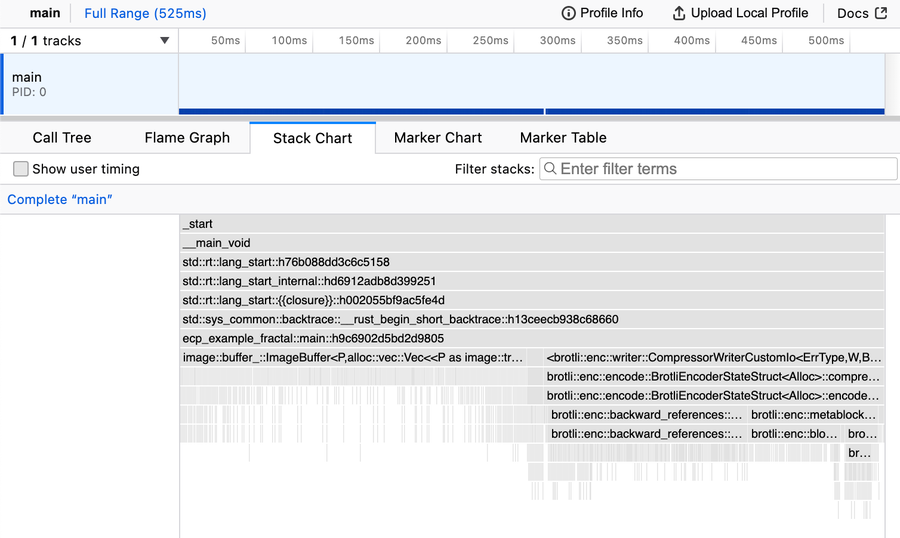
By seeing what stacks are below the main function, we can see that half the time, the call stack has functions for generating the image and half the time is compressing the image as Brotli.
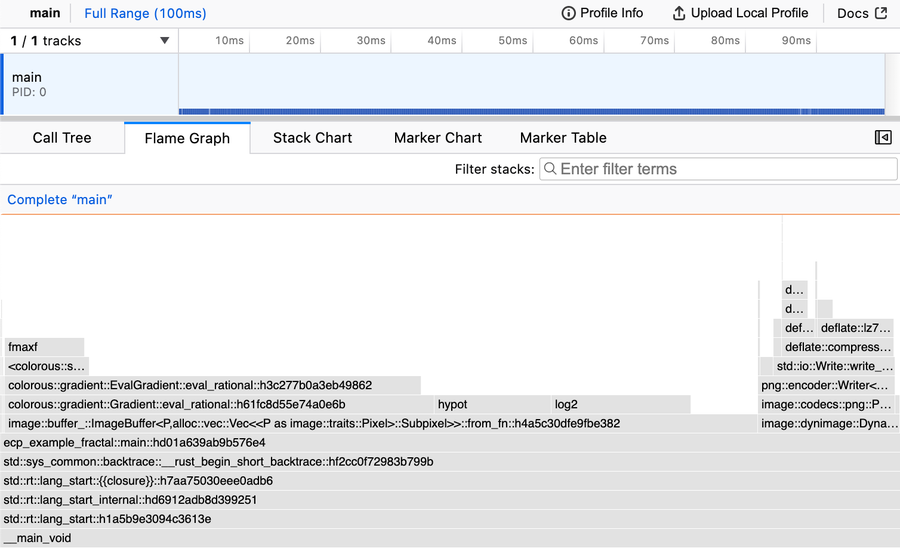
Wait a second: I’m already compressing this image in the image-specific PNG format, so there is no point in compressing it again using general-purpose Brotli! Compressing assets is the best practice, but double compression is a waste of time. I must have copied and pasted that bit of code from another project. If I remove the Brotli compression then the application generates the same images but runs three times faster. This updated flame graph shows that the application now spends most of its time generating the image and the rest encoding the image:
Conclusion
Use the guest profiler via the fastly compute serve --profile-guest command to optimize your Compute applications and make them even faster.
If you’re just getting started with Fastly Compute, check out our learning resources. If you’re new to Fastly, creating an account is free and easy. Sign up to get started instantly!