On the Solutions Engineering team, we help customers optimize the configuration and performance of their Fastly services. One of the recurring optimizations we solve for is making a website load faster — and with Compute, which is used to build, test, and deploy code in our serverless compute environment, we have the ability to not only compare before and after speeds but to do so without modifying the production website. In this way, we can see if the recommendations would actually make the page load faster before implementing them.
Today, I’ll show you an example of how you can use Compute to serve a website both with and without a specific modification and use WebPageTest, a web performance tool that uses real browsers, to compare web performance between the two versions.
Example optimization recommendation
For this example, we’ll look at a public, non-customer site. Web.dev is one of my favorite places to learn, and today we’ll examine the Web Vitals Metrics page.
This page includes two SVG images that are loaded from a third party, which means a new HTTPS connection needs to be set up to make the requests. By running a WebPageTest test, we can see the requests that make up the page load in the waterfall chart:
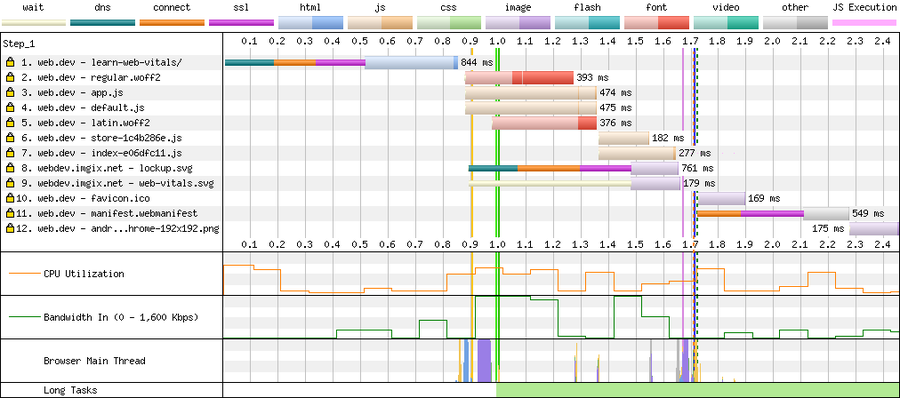
Web page performance test result waterfall chart for https://web.dev/learn-web-vitals/
The blue-orange-purple tail on Line 8 is the delay that results from setting up the new HTTPS connection. The request on Line 9 also waits for this connection. The new HTTPS connection is also visible in the WebPageTest connection chart, where the blue-orange-purple tail on Line 3 shows the delay in setting up the new connection:

Web page performance test result connection chart for https://web.dev/learn-web-vitals/
Opening a new connection can take a while on a high-latency, congested network. The time it takes to serve the small SVG files is miniscule compared to the time it takes to set up the new connection. If this were a customer performance assessment I would recommend serving all assets over the same connection as the HTML content to avoid the additional latency of setting up a new connection. But how much would it help? Let's find out.
Testing the recommendation with Compute
To perform this comparison test, I wrote a Compute application using Rust that passes content to the real web.dev origin. It modifies HTML responses using lol_html, a Rust crate designed to modify HTML on the fly that has a friendly CSS selector-based API.
The SVG images are also present on the origin, so the browser could load them directly from there, reusing the open connection that was used to load the HTML and other assets. I noted where in the HTML the code referenced these SVG files and wrote the following code:
let html = rewrite_str(
  &beresp.into_body_str(),
  RewriteStrSettings {
      element_content_handlers: vec![
          // <img alt="web.dev" class="web-header__logo" src="https://webdev.imgix.net/images/lockup.svg">
          // <img alt class="w-masthead-path__image" src="https://webdev.imgix.net/images/collections/web-vitals.svg">
          element!(r#"img[src^="https://webdev.imgix.net/"]"#, |el| {
              let src = el
                  .get_attribute("src")
                  .expect("img src is required")
                  .replace("https://webdev.imgix.net", "");
              el.set_attribute("src", &src)
                  .expect("unable to set img src");
              Ok(())
          }),
          // <web-side-nav class="unresolved" logo="https://webdev.imgix.net/images/lockup.svg>"
          element!(r#"web-side-nav[logo^="https://webdev.imgix.net/"]"#, |el| {
              let logo = el
                  .get_attribute("logo")
                  .expect("web-side-nav logo is required")
                  .replace("https://webdev.imgix.net", "");
              el.set_attribute("logo", &logo)
                  .expect("unable to set web-side-nav logo");
              Ok(())
          }),

      ],
      ..RewriteStrSettings::default()
  },
)
.unwrap();
I deployed the Compute application to Fastly’s edge cloud. The application is careful to instruct web crawlers to avoid indexing any pages and also denies access unless there is a special x-host header, which is sent by WebPageTest.
I tested the optimization on the command line with curl:
# web.dev using multiple connections
❯ curl -s https://instantly-striking-martin.edgecompute.app/learn-web-vitals/ -Hx-host:1 -Hx-bypass-transform:true | egrep -o 'src=[^=]+?\.svg'
src=https://webdev.imgix.net/images/lockup.svg
src=https://webdev.imgix.net/images/collections/web-vitals.svg

# web.dev using reduced connections
❯ curl -s https://instantly-striking-martin.edgecompute.app/learn-web-vitals/ -Hx-host:1 | egrep -o 'src=[^=]+?\.svg'
src="/images/lockup.svg
src="/images/collections/web-vitals.svg
Looks good! Next, I tested the optimizations with WebPageTest setting up a test from WebPageTest’s London, UK - EC2 location, using Chrome on WebPageTest's simulated 3G Fast network. I picked the 3G Fast network profile to mimic a low-powered mobile device on a mobile network; it’s the default for both WebPageTest’s easy mode and for Google’s PageSpeed Insights. I labelled it "web.dev using multiple connections" and set up an advanced script:
overrideHost web.dev instantly-striking-martin.edgecompute.app
addHeader	x-bypass-transform:true
navigate https://web.dev/learn-web-vitals/
I blocked the following domains to keep focus on the performance of the main website:
www.google-analytics.com www.gstatic.com
firebaseinstallations.googleapis.com
This test result is the test result without the transformation.
Next, I set up another test in a similar way and labelled it "web.dev using reduced connections". I set up an advanced script:
overrideHost web.dev instantly-striking-martin.edgecompute.app
navigate https://web.dev/learn-web-vitals/
I blocked the same domains:
www.google-analytics.com www.gstatic.com
firebaseinstallations.googleapis.com
This test result is the test result with the transformation and this test comparison page shows a comparison between the two test runs.
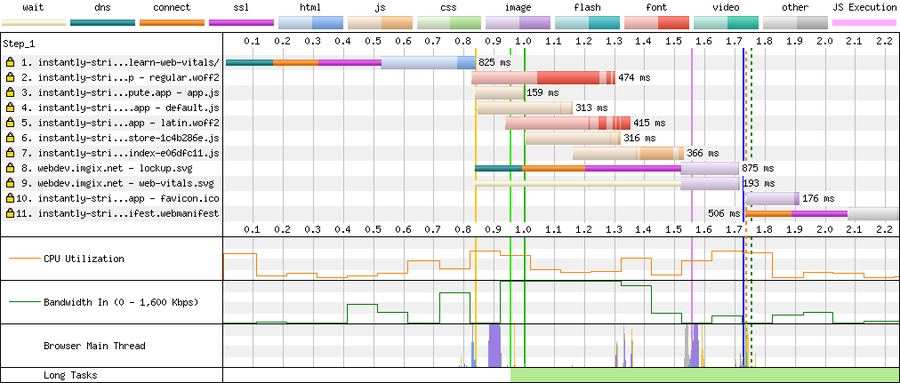
In the waterfall chart without the transformation, the dashed green line represents the Largest Contentful Paint, one of the SVG images, at around 1.75s:
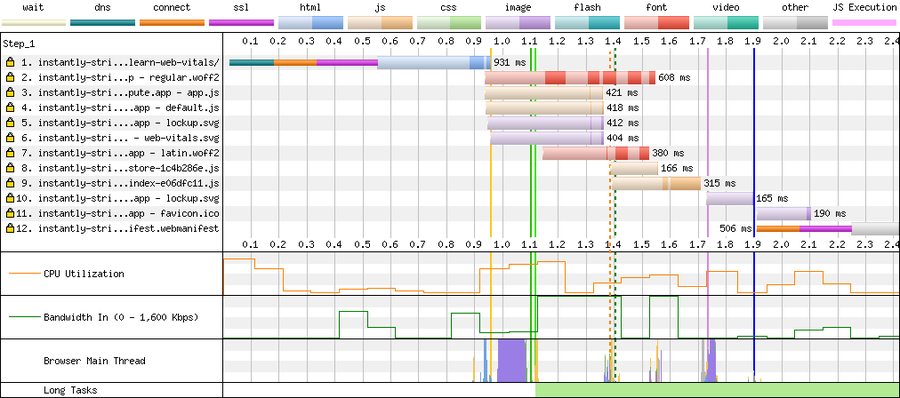
In the waterfall chart with the transformation, we can see SVG files are being loaded from the same origin and that the Largest Contentful Paint is now much earlier, at around 1.2s:
The comparison has more charts, such as the visual progress over time, where you can see that the run with reduced connections displays earlier:
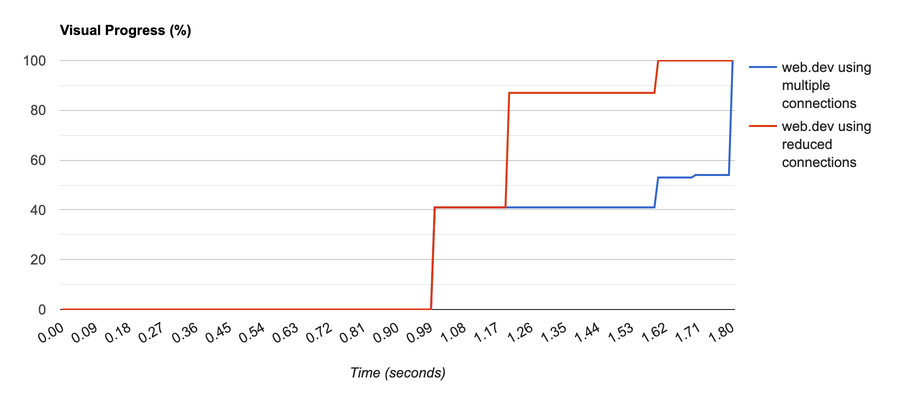
In this comparison video of both runs loading, you can see the image on the top right loads much earlier and the page finishes loading at 1.6 seconds instead of 1.8 seconds.

So in this case, we have proved that the transformation does help for this page! In this way, it’s possible to test a single web performance optimization using Compute to ensure your changes are truly optimizations.
