Our second annual customer summit was a great day of talks and workshops, and we heard from various brilliant speakers on the future of the edge, media 2.0, and clever tips for using Fastly’s Custom Varnish Configuration Language (VCL).
In that vein, Andrew Betts of the Financial Times discussed using VCL to “solve anything” — pushing his team’s problems to the CDN layer. Andrew helped build the original HTML5 web app for the Financial Times, and ran FT labs for three years. He’s currently working with Nikkei (the FT’s parent company) to rebuild nikkei.com. Below is part one in a series recapping his talk (including a few additional Varnish tips from Doc for good measure). In this first post, we’ll cover the benefits of pushing as much as you can to the CDN layer, and address the problems of collecting valuable data at the edge.
Benefits of edge code
As many of you may know, we’re big fans of extending your application to the edge — by pushing logic and content closer to users, Fastly helps you create faster experiences for your customers. Edge code also helps the Financial Times solve problems more effectively, giving them:
Smarter routing
Faster authentication — moved higher up in the stack
Higher cache hit ratio, which leads to:
Reduced bandwidth bills
Improved performance for end users
Andrew’s first experience with coding at the edge was with Edge Side Includes (ESI). “For those of us coding on the web in the late 90s, it’s essentially a copy of server side includes, but moved out to the edge,” he explained. “Basically, ESI lets you serve pages with holes, and the holes would be filled by additional requests to origin for the fragments that would go into those holes.” This works “pretty well,” but you end up with an architecture that couples your back ends to your ESI processing layer so tightly that it’s essentially a big monolith (and although they’re not for everyone, microservices make it easier for you to update parts of your application without overhauling the whole thing. The FT finds that loose coupling works better for their architecture.).
Previously, the Financial Times used “a lot” of ESI, but now they do everything with VCL, because:
Request and response bodies are opaque, simplifying things like debugging and caching and improving performance.
Everything on the edge happens in metadata — where the bodies are data itself and headers are metadata.
It’s very restricted: no loops (making it difficult to mess up).
It’s extensible: useful Fastly extensions include GeoIP and crypto.
It’s incredibly powerful when used creatively.
Andrew discussed the following pain points his company faces, as well as the solutions enabled with the help of VCL.
Debug headers
Adding debug headers lets you collect request lifecycle information in a single HTTP response header, which is great if you:
Find it hard to understand what path the request is taking through your VCL
Have restarts in your VCL and need to see all the individual back end requests, not just the last request
“If you do all of this stuff with VCL,” said Andrew, “you frequently find that when you upload your VCL it doesn’t work.” To determine what went wrong, Andrew sets information into response headers and sees what comes back. Part of what makes this “particularly complicated is trying to wrap your head around the VCL flow everyday” — Andrew keeps the VCL flow taped to the side of his monitor for easy reference.
In order to understand how requests have routed themselves through the VCL flow, Andrew finds it useful to keep a request header and append to it every time they hit a different subroutine. At the end of VCL deliver, they can copy that value back into a response header into the client and that gives them access to a fairly detailed transcript of that request’s journey through the VCL, which will even include restarts:
CDN-Process-Log: apigw:/flags/v1/rnikkei/allocate?
output=diff&segid=foo&rank=X HIT (hits=2 ttl=1.204/5.000 age=4
swr=300.000 sie=604800.000); rnikkei_front_0:/ MISS (hits=0
ttl=1.000/1.000 age=0 swr=300.000 sie=86400.000)
If you restarted (as seen in this case) you’ll get all of the requests included in your transcript and the different cache status for each one. (In this example, you can see one was cache hit and the other was a cache miss.)
sub vcl_recv {
  set req.http.tmpLog = if (req.restarts == 0, "", req.http.tmpLog ";");
  # ... routing ...
  set req.http.tmpLog = req.http.tmpLog " {{backend}}:" req.url;
}
sub vcl_fetch { set req.http.tmpLog = req.http.tmpLog " fetch"; ... }
sub vcl_hit { set req.http.tmpLog = req.http.tmpLog " hit"; ... }
sub vcl_miss { set req.http.tmpLog = req.http.tmpLog " miss"; ... }
sub vcl_pass { set req.http.tmpLog = req.http.tmpLog " pass"; ... }
sub vcl_deliver {
  set resp.http.CDN-Process-Log = req.http.tmpLog;
}
There’s one problem with the VCL above: it doesn’t work for all subs on Fastly (or Varnish 4+). Fastly has extended Varnish to add a clustering feature, which means that requests have a high chance of being handled by two Varnish nodes instead of one. A typical request flow would have vcl_recv run on node A, vcl_miss and vcl_fetch run on node B, and then vcl_deliver on node A again. Changes made to the request headers (req.http.) on node B do not make it back to node A. Similarly, on Varnish 4 and above, you’re not even allowed to change req.http. headers from vcl_miss or vcl_backend_response (which is what vcl_fetch has been renamed to).
To get around this problem, you piggyback the log data on the fetched object instead to get it from node B back to node A, and then you copy it back into the request. (And clean up after.)
Another thing is the {{backend}} bit in the code. This works for Andrew, because he has some code that generates his VCL for him and that replaces this bit with the actual name of the back end. This can be replaced with req.backend, but that unfortunately contains your service ID, and in some cases just the name alone can be dangerous to divulge. So let’s also add the requirement of a very specific value for the info to be added to the response. And then you can also add beresp.backend.ip to the info and without having to worry about the origin getting attacked.
And remember that req.http.tmpLog can easily be added to your logging format, so that even if the log data isn’t returned to the client, you can still follow along in logs.
The resulting VCL would look something like this:
sub vcl_recv {
  set req.http.tmpLog =
    if (req.restarts == 0, "recv", req.http.tmpLog "; recv");
#FASTLY recv

### Backend selection goes here, if not already in the include ###

# Strip out the service ID for readability
  set req.http.tmpLog =
    req.http.tmpLog "[" regsub(req.backend, "^[a-zA-Z0-9].*--", "")
    ":" req.url "]";
  ...
}

sub vcl_fetch {
  # Anything set on beresp.http.* is stored with the object
  # and in the case of clustering, returned to the node that
  # is handling the request from the client.
  set beresp.http.tmpLog =
    req.http.tmpLog " fetch[" regsub(beresp.backend.name, "^[a-zA-Z0-9].*--", "")
    ":" beresp.backend.ip "]";
#FASTLY fetch
  ...
}

sub vcl_hit {
  # Unfortunately this only works on the edge node
  set req.http.tmpLog = req.http.tmpLog " hit";
#FASTLY hit
  ...
}

sub vcl_miss {
  set req.http.tmpLog = req.http.tmpLog " miss";
#FASTLY miss
  ...
}

sub vcl_pass {
  set req.http.tmpLog = req.http.tmpLog " pass";
#FASTLY pass
  ...
}

sub vcl_deliver {
  # All the headers stored with the object (beresp.http.* in
  # vcl_fetch) are copied into resp.http.*. So we need to be
  # selective as to when we use resp.http.tmpLog or
  # req.http.tmpLog. The possible cases are hit, miss, pass,
  # synthetic, or error. Only in the hit case do we need to ignore
  # what's in resp.http.*
  if (fastly_info.state !~ "^HIT") {
    set req.http.tmpLog = resp.http.tmpLog;
  }
  # Even if it's a hit, the tmpLog header will still be there
  # from when the object was retrieved, which can get confusing,
  # so let's just delete it.
  unset resp.http.tmpLog;

# Add our debugging info
  set req.http.tmpLog = req.http.tmpLog " deliver[" fastly_info.state
    ":hits=" obj.hits ":age=" resp.http.Age "]";
  if (req.http.Fastly-Debug == "my secret key") {
    set resp.http.CDN-Process-Log = req.http.tmpLog;
  }
#FASTLY deliver
  ...
}

sub vcl_error {
  # obj.http.* turns into resp.http.* in vcl_deliver
  set obj.http.tmpLog = req.http.tmpLog " error [" obj.status ":" obj.response "]";
#FASTLY error
  ...
}
When copy/pasting this code, please remember to change the secret key. :)
RUM++
FT uses real user monitoring (RUM) to collect effective performance data on the front end and combine it with appropriate grouping metrics (they don’t want just one number, they want to be able to segment and filter that number by various other things). They can track down hotspots of slow response times as well as understand how successfully end users are being matched to their nearest POPs, using VCL to capture and store that data — “because RUM data that’s beaconed back to your servers is generally not something we can cache.”
A typical RUM setup has each beacon request go all the way back to a database, since each request records the unique viewpoint of a single user at a single point in time. The number of requests that generates is directly proportional to the number of requests for pages and assets. But where pages and assets can normally be cached with a very high hit ratio, that is not the case for RUM beacons.
With the polyfill service, for instance, for which they’re serving 500 million bundles per month, and their cache hit ratio is “well over 99.9%,” they can handle that much traffic using one basic Heroku instance. However, if they deploy RUM (which is going to send a beacon for every bundle downloaded) then that capacity would not be nearly enough. Instead of spinning up a massive capacity increase on their origin servers, FT collects the data and streams it to S3 buckets, using Fastly’s real-time log streaming.
They start by collecting the data on the front end:
var rec = window.performance.getEntriesByType("resource")
.find(rec => rec.name.indexOf('[URL]') !== -1)
;

(new Image()).src = '/sendBeacon'+
'?dns='+(rec.domainLookupEnd-rec.domainLookupStart)+ '&connect='+(rec.connectEnd-rec.connectStart)+ '&req='+(rec.responseStart-rec.requestStart)+ '&resp='+(rec.responseEnd-rec.responseStart)
;
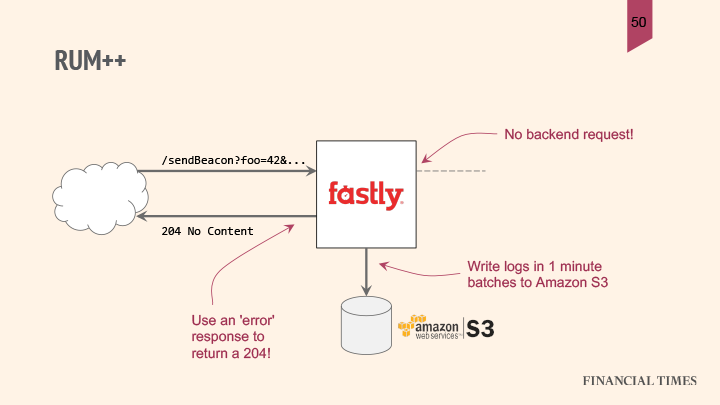
They use the resource timing API to collect accurate performance data for the connection characteristics of one single resource that they can pull out of the collection exposed by this API. After a bit of math, Andrew can figure out the durations of the DNS TCP request and response phases of the connection, can construct a query string, and then send that back to FT’s server. Because FT’s server is routed through Fastly, Andrew uses VCL to detect that he’s sending the request to the beacon URL and send an immediate 204 no content response, without accessing a back end:
sub vcl_recv {
    if (req.url ~ "^/sendBeacon") {
        error 204 "No content";
    }
}
“Now that seems like a stupid thing to do because I just lost my RUM data,” said Andrew. But he didn’t: “Because Fastly has log streaming I can actually write this data via log streaming to Amazon S3 in hourly batches.”

Andrew doesn’t need to deal with these responses on his back end, but writes them into a batch file, later using a service like Lambda to pick up those logs in batches from S3 and write them into a database like Redshift or MySQL. This requires much less resources.
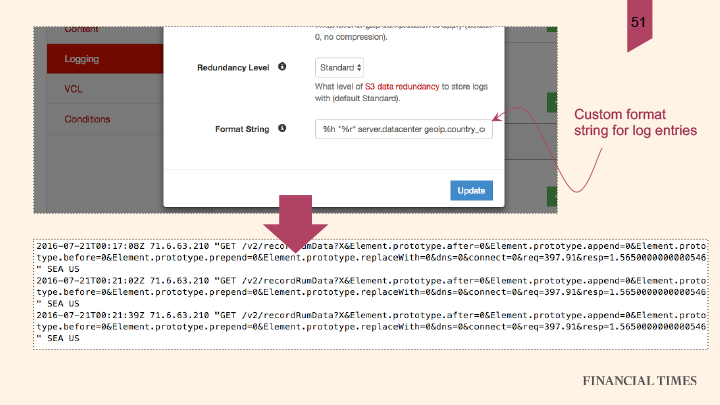
In order to do this yourself, write a custom log format into the configuration UI:

You’ll see one line per RUM request in your logs. “With a bit of data crunching,” Andrew advised, “you can easily produce some really nice stats.”
For more on data collection at the edge, check out VP of Technology Hooman Beheshti’s blog on beacon termination.
Watch the video of Andrew’s presentation below, and check out part 2: SOA routing and non-ASCII.

