As a developer, you need tools to quickly identify and resolve availability and performance issues to maintain a seamless user experience. One such crucial tool you can count on is Log Explorer & Insights, which unlocks valuable insights within your log data to drive informed decisions and identify opportunities for optimization and innovation.
We’re excited to announce that Log Explorer & Insights has transitioned from beta to general availability with significant improvements as part of our Observability Packages. With this feature, you can gain insights by proactively storing, monitoring, and inspecting log data directly on the Fastly Platform via the API or console, without requiring you to build complex data pipelines. Log Explorer & Insights includes two major functionalities: Insights and Log Explorer.
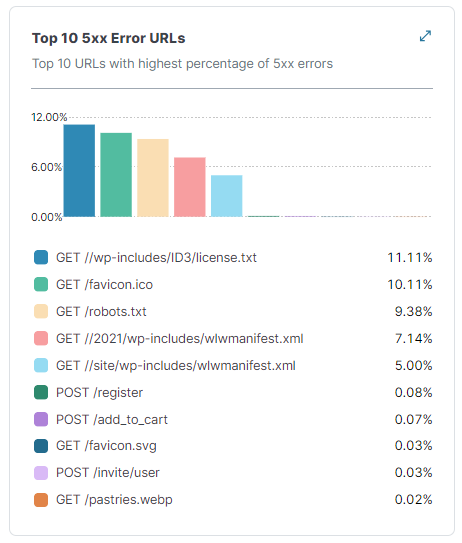
Insights dashboard provides unique and actionable insights in the form of visualizations to proactively identify trends, optimize performance, and troubleshoot issues. For example, the Top 10 5xx Error URLs visualizes and lists properties causing the highest percentage of 5xx errors, so you can quickly identify and address critical issues for optimal performance. An expanded view of the visualization also allows you to view more error URLs beyond the top 10, while also providing an option to view logs related to a visualization to analyze issues contextually in Log Explorer.

Visualization showing top URLs based on the percentage of 5xx errors

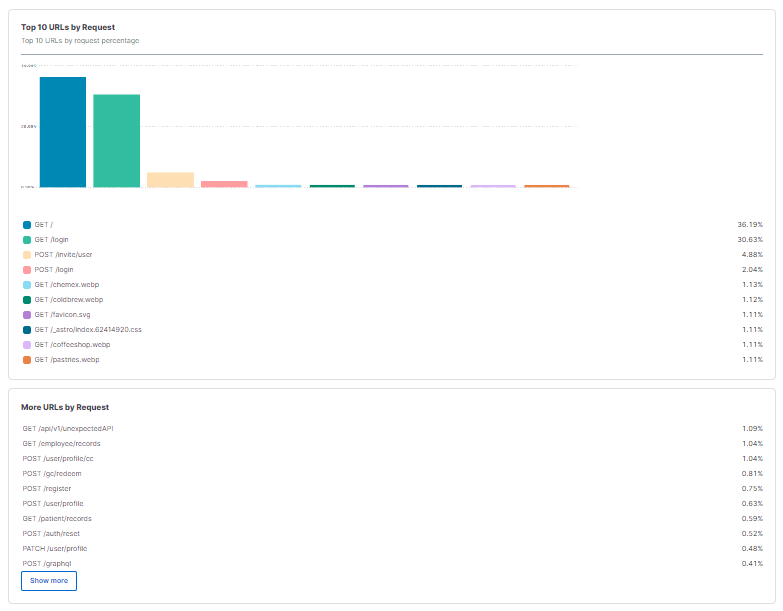
Visualization showing the top URLs by request volume

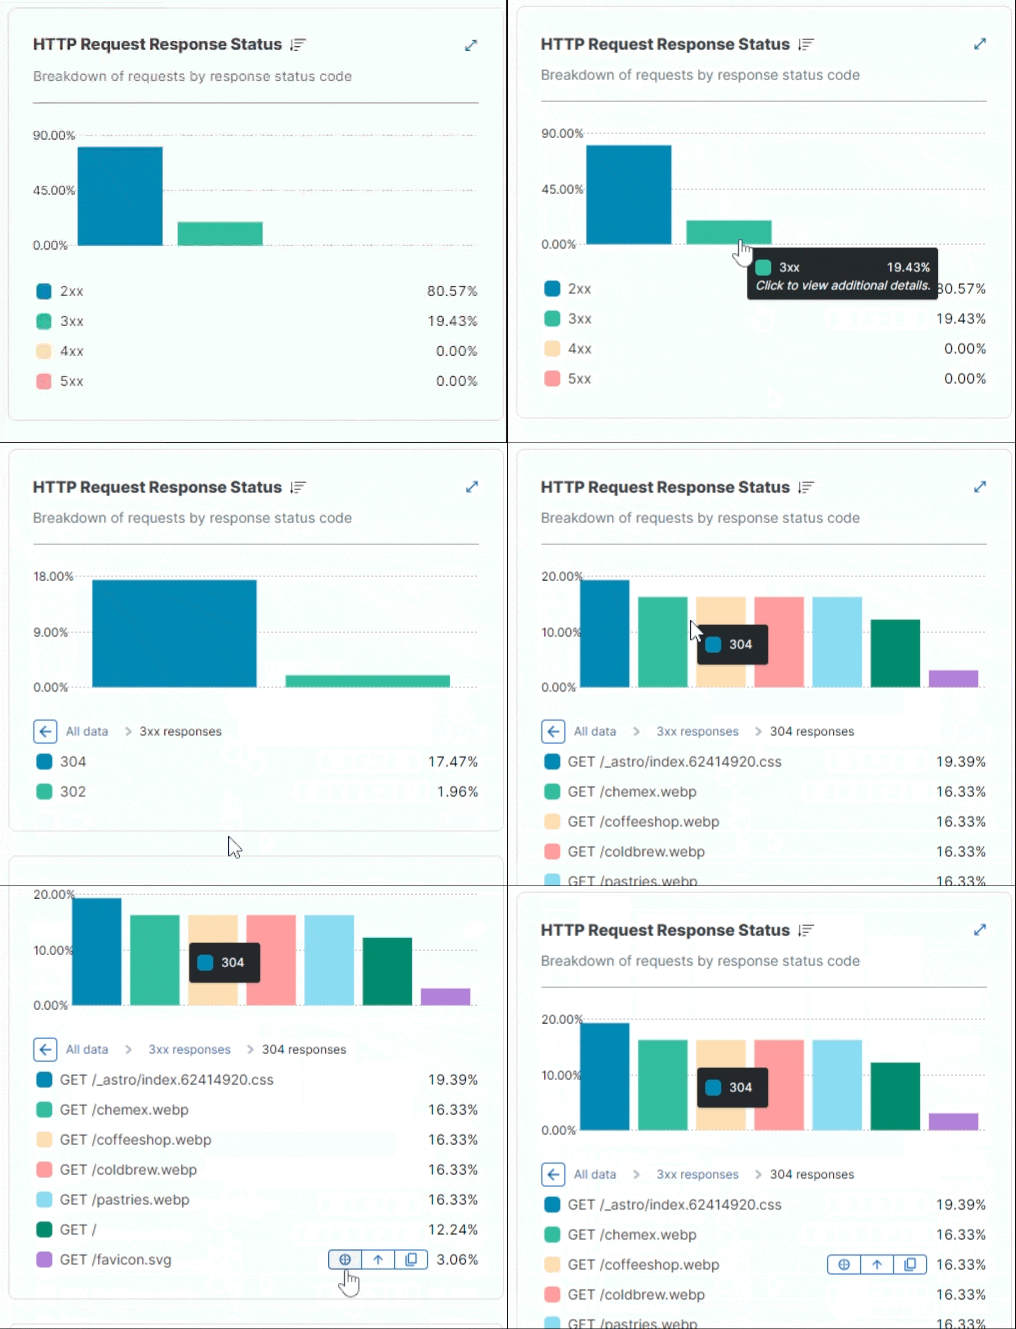
Drill-down interactivity for detailed insights
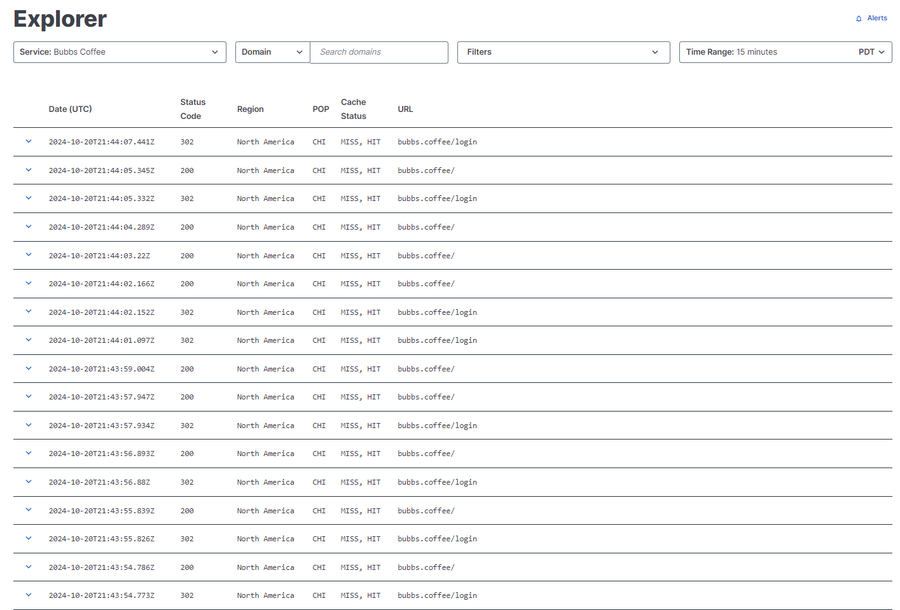
In addition, Log Explorer allows you to view, filter, and analyze individual logs directly within the Fastly console or API, without having to send log data to a third-party data collector. You can apply multiple filters to narrow down the data and view all the data fields by expanding a log row and obtaining key information to troubleshoot issues effectively.

With Log Explorer & Insights, you get instant visibility, actionable insights, and easy monitoring, enabling you to manage your web property with less effort and deliver a better experience for your users.
Instant visibility for quick detection and timely action: When performance issues strike, time is everything. Log Explorer & Insights provides you with instant visibility into edge request performance, helping you detect potential problems or anomalies before they turn into critical events. With real-time insights, you can swiftly troubleshoot and debug issues, minimizing downtime and keeping your site running smoothly.
Granular and actionable information: With Log Explorer & Insights, you gain access to granular insights that go beyond the surface. An intuitive dashboard lets you drill down into key metrics like error breakdown or requests by browsers. You can click on specific error types and immediately view detailed data, allowing you to pinpoint issues with precision and resolve them faster.
Utilize as an extension to Origin and Domain Inspector: Augmenting Origin Inspector and Domain Inspector with Log Explorer & Insights for troubleshooting can provide you with enhanced visibility, enabling you to analyze request traffic, detect error patterns, identify and debug performance issues to ensure your websites and services run smoothly. For instance, if you notice an increase in errors from an origin via Origin Inspector or an increase in errors from a domain via Domain Inspector, what should you do next? Leverage Log Explorer & Insights to dive deeper and examine specific requests and error types, helping you pinpoint the root cause of the issue instantly.
Self-serve enablement and easy monitoring: Turning on and accessing insights is as easy as flipping a switch. Monitoring your web property’s performance is made simple with the comprehensive self-serve features offered by Log Explorer & Insights. You can view multiple perspectives of your logging data, helping you spot trends and optimize your services continuously.
Getting Started with Log Explorer & Insights
Reach out to your account manager or contact us at support@fastly.com to enable and try Log Explorer & Insights on your services. You may also try Observability for free or contact sales@fastly.com with any questions.
