Over a year ago, we embarked on a journey to build an all-encompassing, flexible interface to centralize visibility and insights across your Fastly account and services. Today, we are excited to bring this new interface, Edge Observer, into public beta - now available to all accounts and customers.
Edge Observer builds upon our existing Stats experience and comes with a host of new features and functionality. It is aimed at alleviating the stress and time it takes to obtain end-to-end visibility from edge to origin - sending logs to third-party tools, endless log parsing, data extraction, high volumes of data storage, or managing multiple data tools and views. Edge Observer is the entry point for all of our Observability products and our single, unified interface that provides both real-time and historic metric views at the account, service, and product levels.

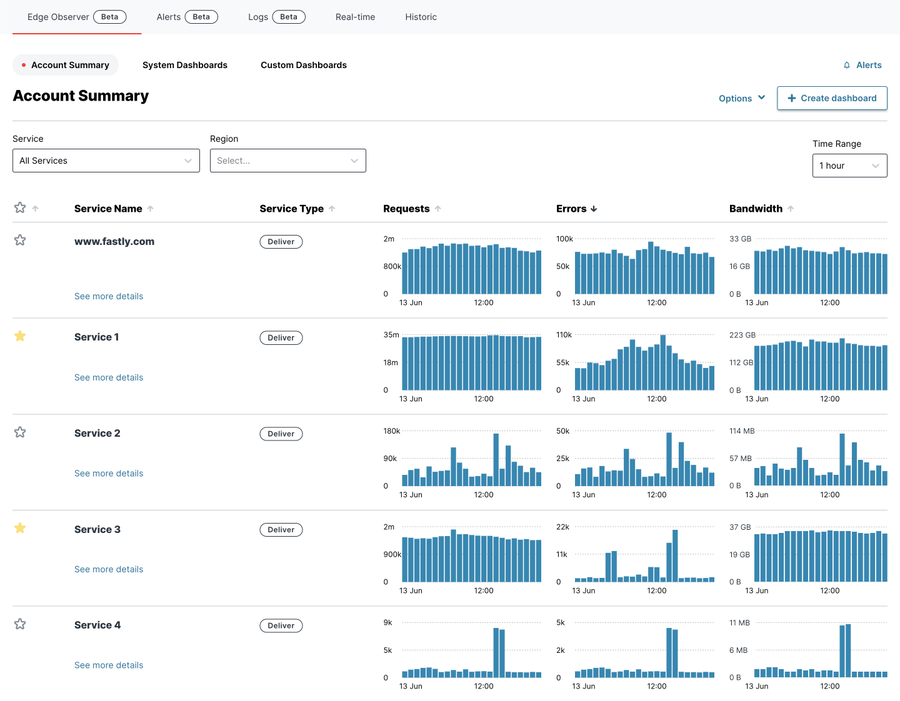
View your Account Summary page for a single view of all your services, and quickly sort services by requests, errors, or bandwidth.
Upon arriving in Edge Observer, you’ll notice the Account Summary page that provides a comprehensive overview of all your Fastly services. Effortlessly sort through services by RPS (requests per second), errors, or bandwidth or search for a particular service. Selecting a service brings you to the Service Overview dashboard, which displays key insights on a service. You’ll notice that each page features an updated time range picker, new graph styling options, and an accessible data visualization color palette. In addition to these significant improvements, we’re enhancing our date-time selectors by adding the ability to toggle between local and UTC time zones and access common time ranges through a single click. We continue to offer an intuitive experience for selecting custom time ranges as well.
Take your exploration further and navigate to our other System Dashboards or individual product-level views using the dashboard selector. Each view has been thoughtfully crafted to give you visibility and insights from the available products you trial or purchase. For example, you can analyze individual origin status codes and errors or performance metrics related to WebSockets in their respective dashboards.

Compare origin and domain metrics together in customized views. Please note: Both origin and domain-level data are available through products sold separately.
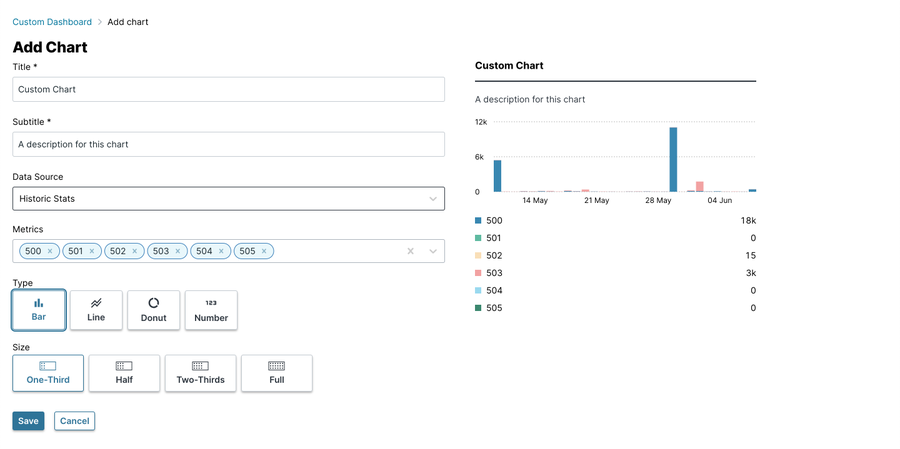
While our pre-configured System Dashboards were created to provide immediate insight into your services and their performance, we understand that each organization and team has unique use cases and requirements. Custom Dashboards offer you the ability to easily tailor your monitoring experience for your organization and are seamlessly shared across a company account. All real-time and historic metrics are available for products activated or purchased on your account, and additional customization options such as chart type and size are supported as well.

Build together your own custom view with a real time preview using our new custom chart flow
We extend a huge thank you to all of our initial beta customers for their invaluable contribution in evaluating and providing feedback to guide the next iteration of Edge Observer. Even with all these new features and capabilities, we’re committed to the continuous improvement and expansion of our Observability product line. Expect to see more chart types, automated alerting, more granular insights, and even more customization options in the future.
The power is in your hands
We’re excited for you to try Edge Observer and we look forward to receiving your valuable feedback to help shape the evolution of our product. Please reach out to us at support@fastly.com with any suggestions or comments. Remember to sign up for a free 30-day Origin and Domain Inspector trial or reach out to your account manager to sign up for our Fastly Alerts beta.

