Fastly's Observability Unleashed: New Updates and Insights

Senior Manager, Product Management, Fastly

Senior Product Manager - Observability, Fastly
In case you missed it, we released upgrades to our Fastly packages that allow our customers to buy multiple features under one product package, which makes monthly billing and costs predictable. Today, we're excited to tell you more details about some of the new features included in the Observability packages.
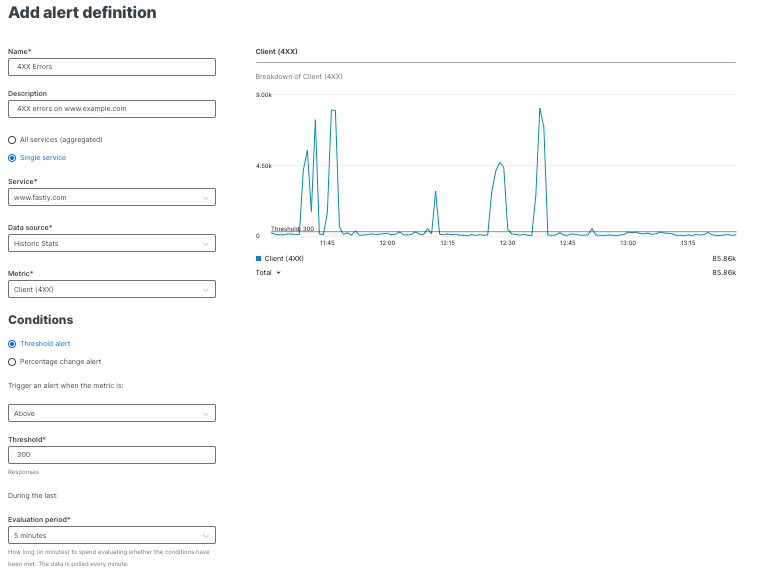
Assess service metrics with custom alerts
Always On 24/7 monitoring - Fastly's alerting feature is a vital tool of our Observability suite, ensuring operators are always aware of issues affecting their applications and origin infrastructure. With the ability to configure notifications and receive real-time insights, you can rest assured that you will always be informed of the health and performance of your services (whether CDN or Compute), enabling you to provide superior user experiences that inspire confidence and trust. Notify the right teams by delivering alert notifications via email or to destinations like Slack, Microsoft Teams, or PagerDuty escalation workflows.

You can also find alerts integrated intentionally throughout our observability interfaces to aid in quicker troubleshooting and to keep notifications in close proximity to the critical monitoring areas of your service and origin infrastructure. We also released support for Terraform to create and manage all your alerts as code. Quickly apply and manage multiple alerts and even apply them across several services simultaneously!

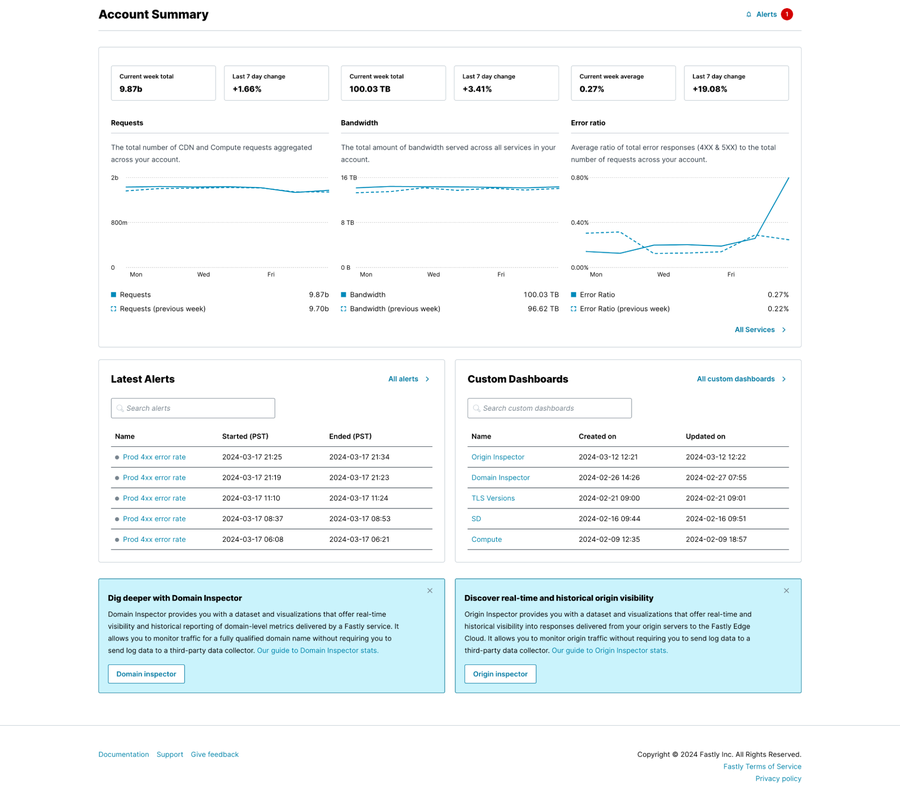
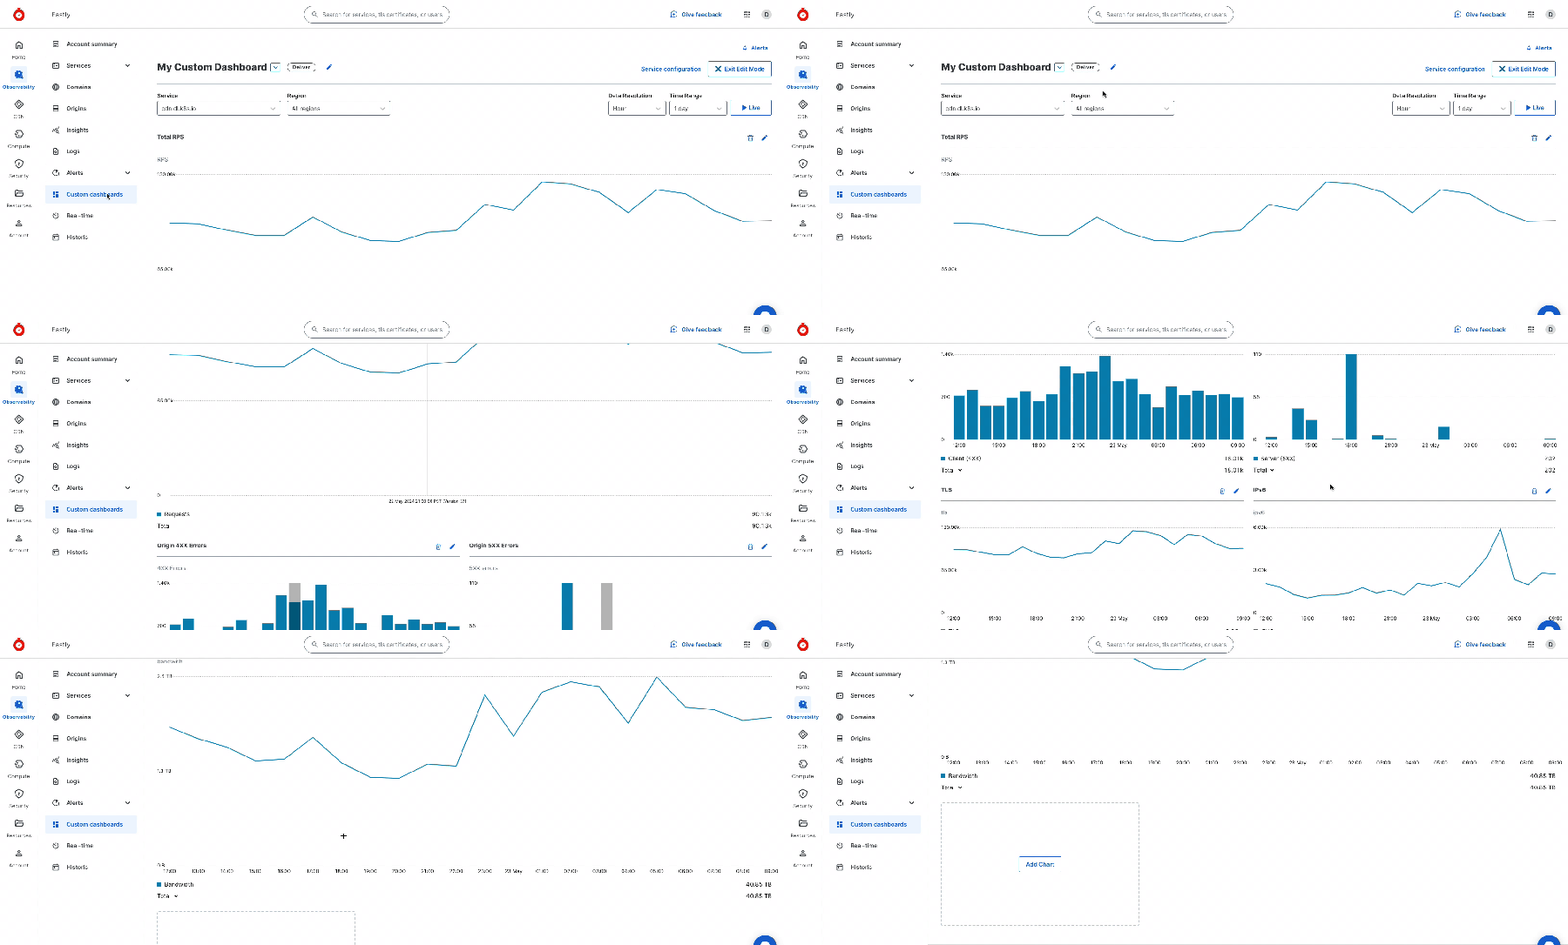
Introducing Edge Observer, the updated interface for all your Observability use cases. With Edge Observer, you can analyze trends across all your services using our Account Summary view or dive into specific services with the Service Overview. You can easily split data between CDN or Compute, and unlock the power of your data with custom dashboards. Visualize and analyze data in a way that aligns with your business objectives and gain actionable insights that will help you optimize performance, enhance collaboration, and streamline decision-making.

Custom dashboards are now available as a part of any Observability package.
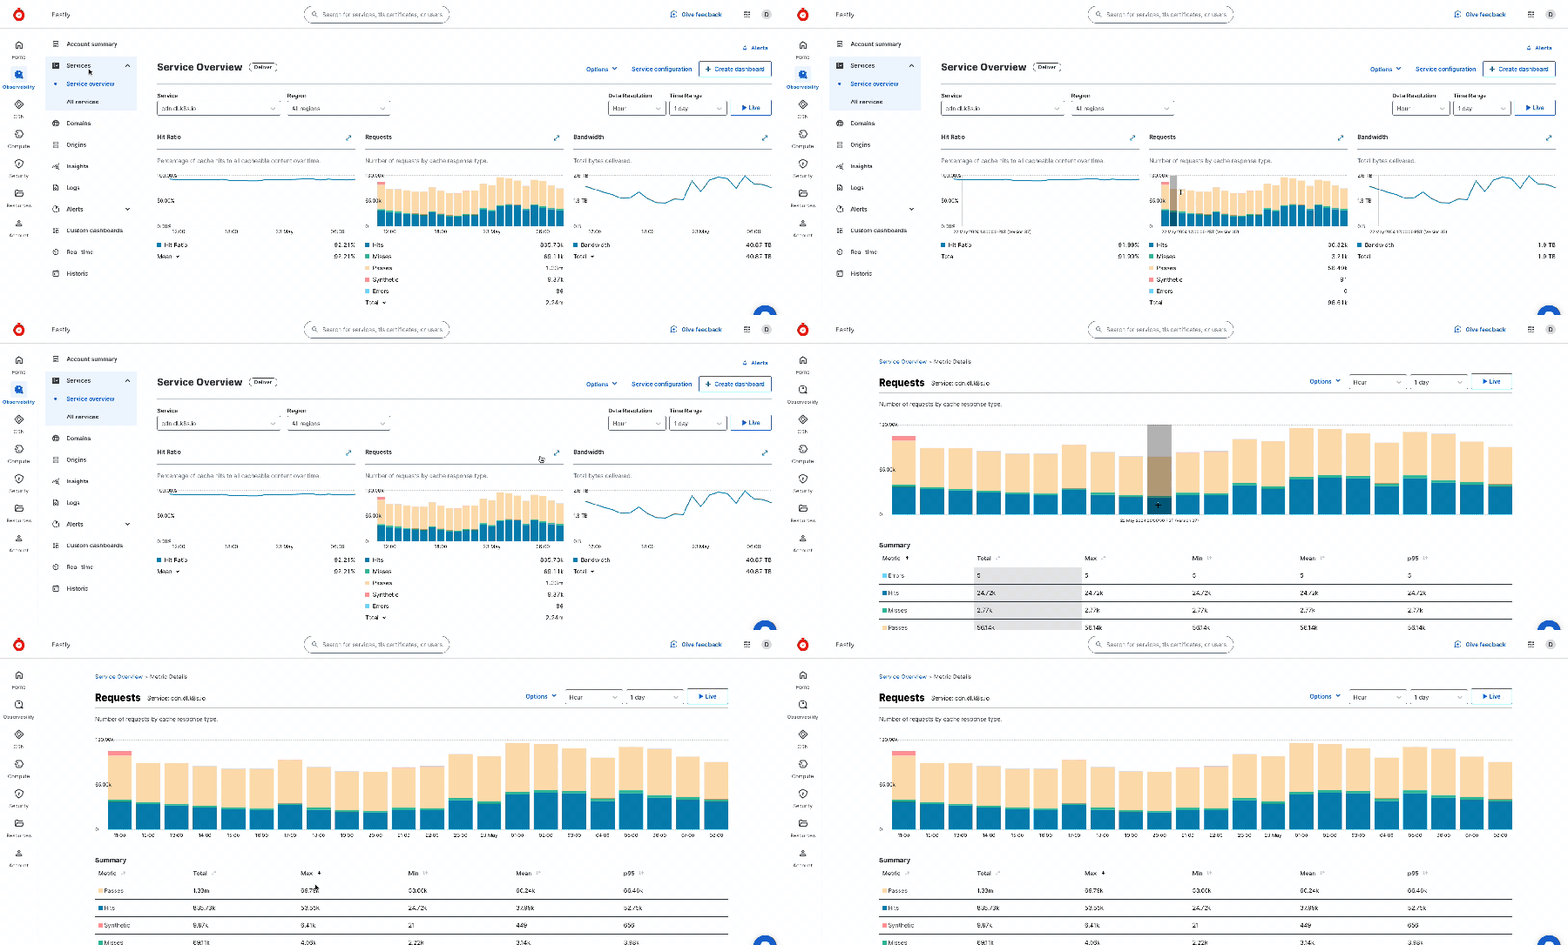
We also introduced metric detail pages that enable you to zoom in further on a specific metric. We show averages, maximum, minimum, or P95 values across various selected time frames and a tabular view of the data. We also included an alerts section to view and monitor any applicable alerts. We’re excited to improve this page to include even more valuable observability data, and insightful analytics to make troubleshooting easier and within a single, unified view.

In addition to all these changes, our Compute Log Tailing UI provides access to a live view of your compute logs and easily filters between stderror or stdout messages. We’re excited to integrate our logs more closely into the daily interfaces you use to easily discover what you are looking for.
Ready to give our latest Observability features a go?
Contact your account manager or check out our Observability packages.
Reach out to our support teams if you have any questions or would like to provide any additional feedback.