With the U.S. election less than a week away, people are turning to news media outlets for up-to-the-moment trends, predictions, and analysis. The pundits and polls say the 2024 presidential race is too close to call, and the final outcome could rest with voters in seven battleground states. Certainly, the 2024 U.S. election is the top news story.
Just how close is this year’s election?
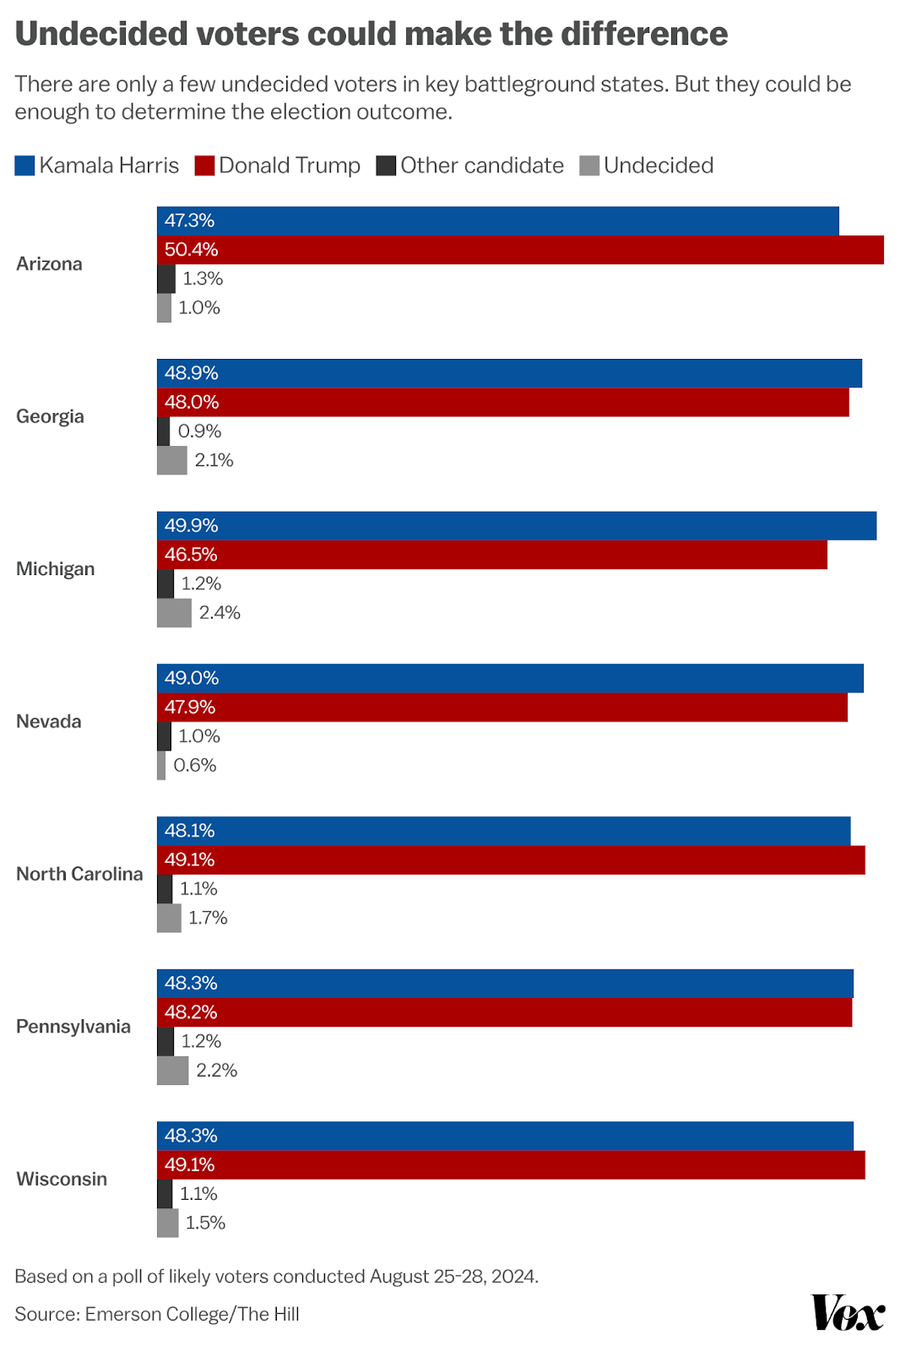
An Emerson College poll estimates the undeclared voter percentages in each swing state. You can see the undecided voters are a percentage point or two in size, but a decisive factor when you see the slim margin between the two parties.
Traditionally, news has been absorbed live with local and national television and cable broadcasts, radio, and print sources. However, the use of digital devices is a preferred option where one study indicates a large majority of U.S. adults (86%) say they at least sometimes get news from a smartphone, computer, or tablet, including 57% who say they do so often.
So, this prompted us to measure online traffic with news media outlets during the 90-minute presidential and VP debates. Knowing the options, how were people absorbing the debate content? Watching a live broadcast? Taking the debate in via their favorite online news outlet?
Presidential and VP Debate viewing audience
To measure the live broadcast viewing, we turned to Nielsen’s official viewing numbers and ratings of the two debates. For those not aware, Nielsen collects data via selected households on what they are watching on each of their TV sets. They can then provide estimates of how many people watch a specific broadcast in the US. Networks use viewership ratings to see how content is performing and decide which programs to renew and which to cancel.
The chart below includes the number of people who viewed the Harris vs. Trump 2024 presidential debate live across the 15 broadcast and cable networks that carried the live debates. They also provide viewer demographics, the size of the audience, and viewer ratings. The viewer rating reflects the percentage of the public participating in the rating services that watched the debate. For example, 41% of Persons 55+ were watching the debate, while 59% watched something else or didn’t watch the television. This is considered a high mark, especially when compared with the 9% of Persons 18-34.
Viewer Demographics | Viewer Audience | Viewer Rating (%) |
|---|---|---|
Persons 2+ | 67,135,000 | 21.2 |
Households | 45,571,000 | 36.2 |
Persons 18-34 | 6,470,000 | 9.0 |
Persons 35-54 | 16,880,000 | 20.6 |
Persons 55+ | 41,349,000 | 41.0 |
Source: Nielsen. NNTV, Live+Same-Day. Data in this table is inclusive of broadcast and cable networks that aired the event. Reported networks include: ABC, CBS, FOX, NBC, Merit Street, Scripps News, Telemundo, Univision, BET, CNN, CNNe, FOX News Channel, FOX Business, MSNBC, Newsmax, NewsNation, and PBS.
A month later, 43.1 million tuned into the 2024 VP debate - Walz vs. Vance.
Viewer Demographics | Viewer Audience | Viewer Rating (%) |
|---|---|---|
Persons 2+ | 43,145,000 | 13.6 |
Households | 30,035,000 | 23.9 |
Persons 18-34 | 3,013,000 | 4.2 |
Persons 35-54 | 9,469,000 | 11.5 |
Persons 55+ | 29,652,000 | 29.4 |
Source: Nielsen. NNTV, Live+Same-Day. Data in this table is inclusive of broadcast and cable networks that aired the event. Reported networks include: ABC, CBS, FOX, NBC, Merit Street Media, Scripps News, CNN, CNNe, FOX News Channel, FOX Business Network, MSNBC, NBC Universo, Newsmax, NewsNation, and PBS.
Measuring news media outlet traffic during the debates
To provide a different view of possible news gatherings during the presidential and VP debates, we decided to measure the traffic levels with online news publishing websites. And, for extra measure, we measured the online activity with the swing states to see if there were any possible deviations.
To do so, we utilized data from Fastly’s modern CDN (content delivery network), the industry-leading system of distributed servers that deliver web content and pages to users based on geographic locations to improve performance and reduce latency. Fastly’s large media publishing companies were used to measure online traffic during the debates. A high-performing CDN allows you to see traffic spikes that can overload a website, degrading the user experience with slow response times.
Analysis criteria and measurements
Fastly research analysts measured and compiled the traffic with five major online news outlets over a 52-hour period, 24 hours before and 28 hours after the start of the debate. These measurements allowed us to easily see normal traffic levels and traffic spikes.
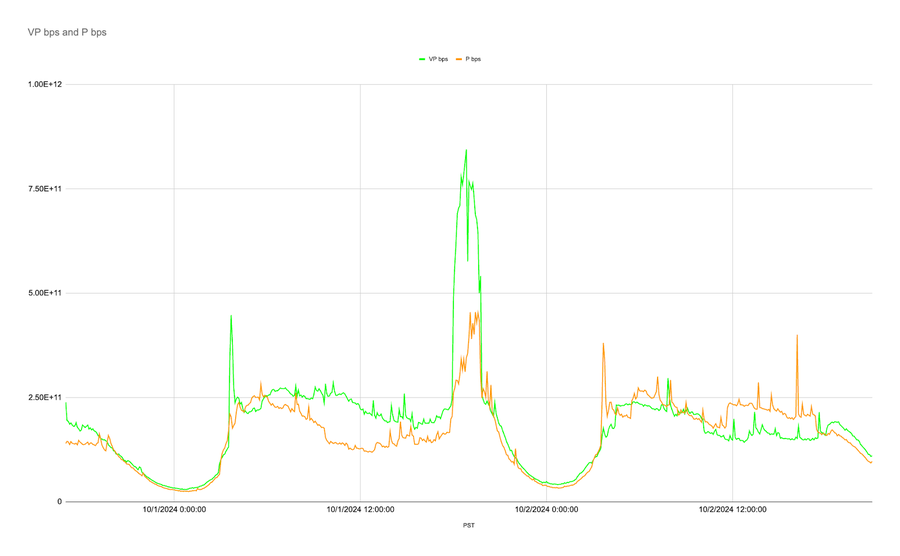
The graph below displays the aggregated traffic for the entire U.S. The X-Axis reflects the timeline before, during, and after the debates. The presidential debate is in red and the vice presidential debate is in green:
U.S. (estimated population: 345.4M)
X-Axis: Timeline before, during, and after the debates.
Overall, the patterns for the two debates were similar and as expected, the traffic peaked during the debates. The presidential debate traffic peaked near the end of the debate at the 19:25 point (over 454 gigabits per second). What was not expected was that the traffic during the VP debate almost doubled the presidential event, reaching a peak at the 18:50 mark (over 844 gigabits per second). One explanation for this could be the fact that 24 million more people watched the presidential debate live broadcast vs. the VP debate, and younger demographics may have sought news online via devices.
You’ll notice the two orange traffic spikes following the debate which could be explained by news coverage of 9/11 activities.
Now, what about the aggregated traffic patterns with news outlets in the battleground states? Let's take a closer look at the traffic and note the peaks across the same timeline.
Pennsylvania (estimated population: 12.95M)
X-Axis: Timeline before, during, and after the debates.
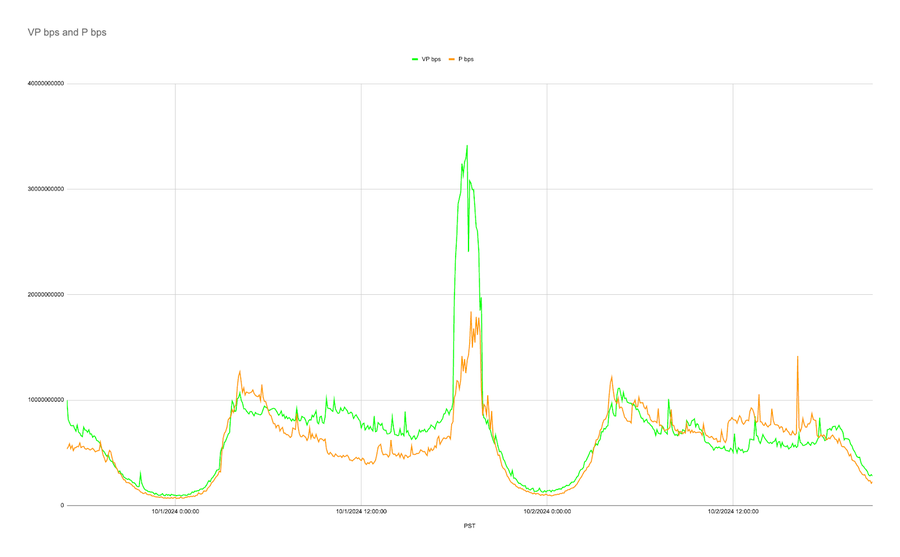
President: 18.4 Gbps at 19:05
VP: 34.1 Gbps at 18:50
Michigan (estimated population: 10.04)
X-Axis: Timeline before, during, and after the debates.
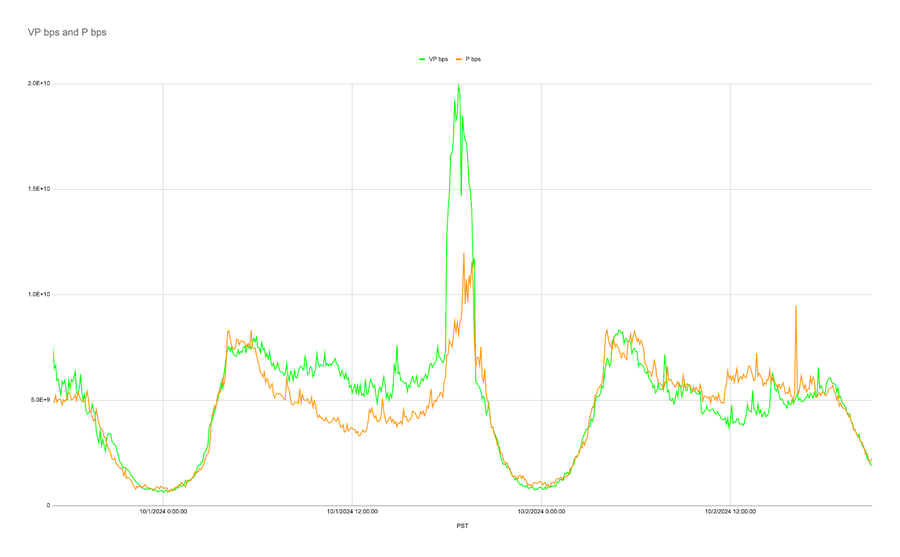
President: 11.9 Gbps at 19:05
VP: 19.8 Gbps at 18:45
Wisconsin (estimated population: 5.93M)
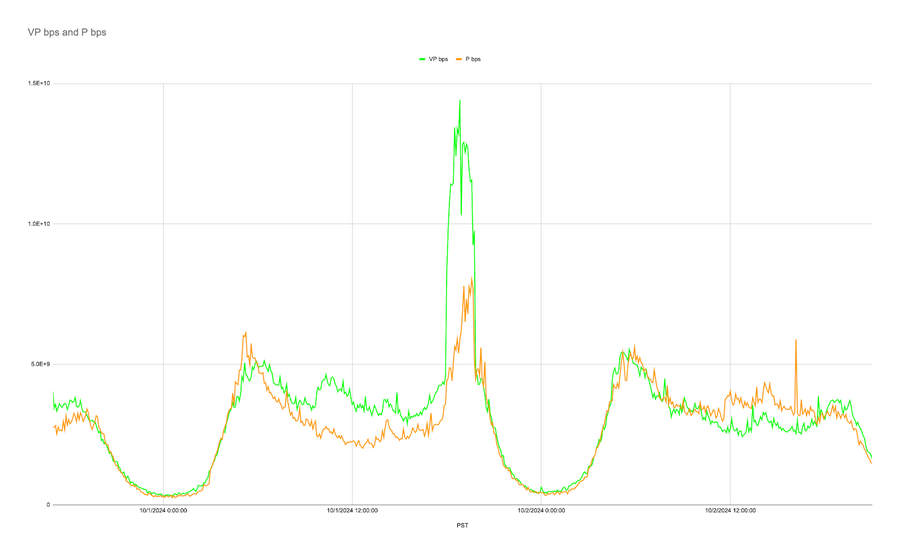
X-Axis: Timeline before, during, and after the debates.
President: 8.0 Gbps at 19:35
VP: 14.4 Gbps at 18:50
North Carolina (estimated population: 10.97M)
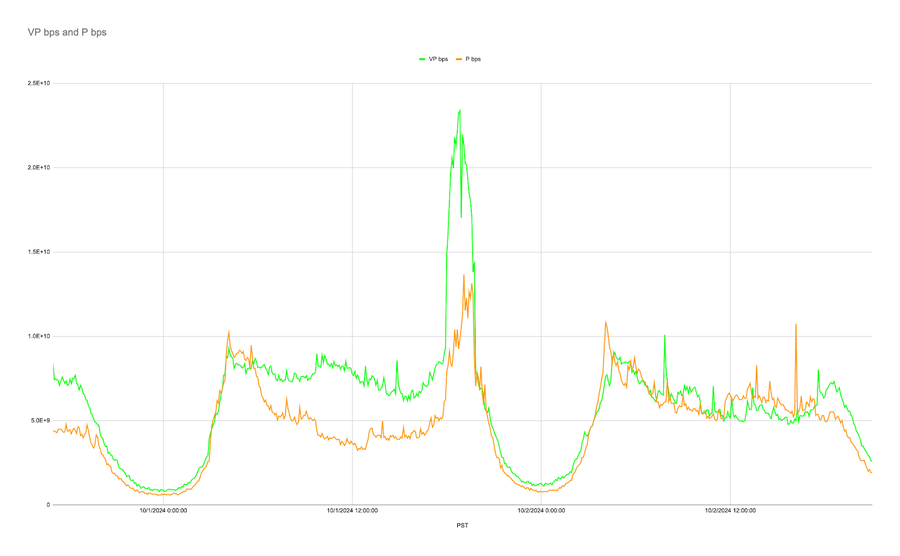
X-Axis: Timeline before, during, and after the debates.
President: 13.6 Gbps at 19:05
VP: 23.4 Gbps at 18:50
Georgia (estimated population: 11.14M)
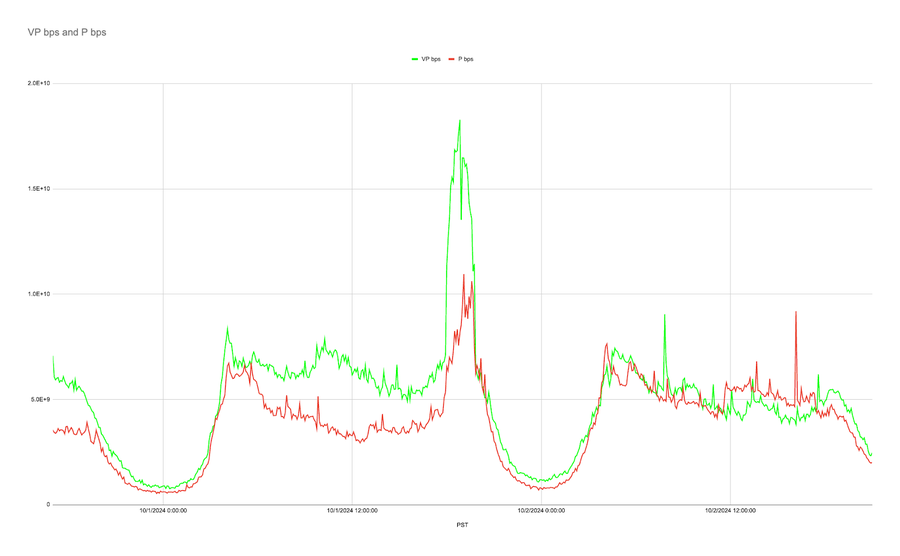
X-Axis: Timeline before, during, and after the debates.
President: 10.9 Gbps at 19:05
VP: 18.2 Gbps at 18:50
Arizona (estimated population: 7.49M)

X-Axis: Timeline before, during, and after the debates.
President: 7.1 Gbps at 19:35
VP: 11.1 Gbps at 18:50
Nevada (estimated population: 3.21M)
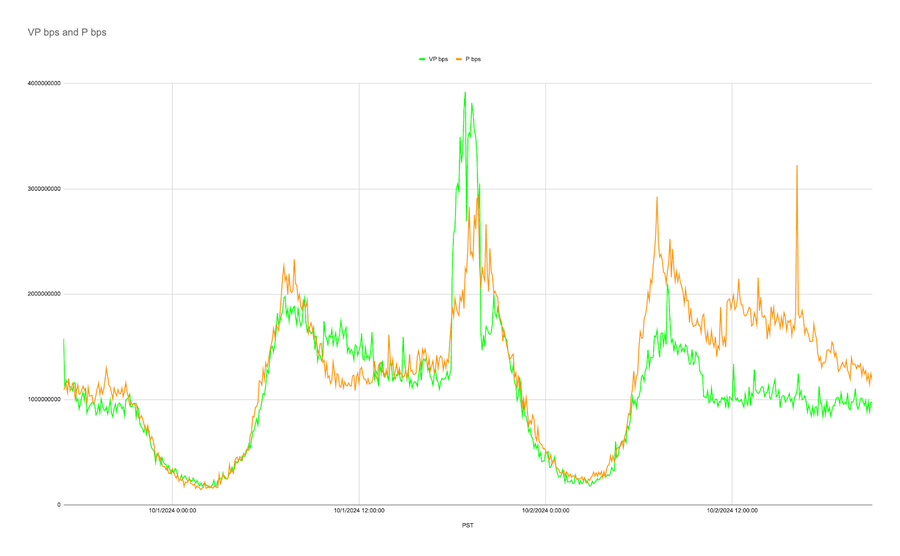
X-Axis: Timeline before, during, and after the debates.
President: 2.9 Gbps at 19:40
VP: 3.9 Gbps at 18:50
News media outlets' peak stats (during debate, gigabits per second)
State | Presidential Peak | Time | VP Peak | Time |
|---|---|---|---|---|
All U.S. | 454 | 19:25 | 844 | 18:50 |
Pennsylvania | 18.4 | 19:05 | 34.1 | 18:50 |
Michigan | 11.9 | 19:05 | 19.8 | 18:45 |
Wisconsin | 8.0 | 19:35 | 14.4 | 18:50 |
North Carolina | 13.6 | 19:05 | 23.4 | 18:50 |
Georgia | 10.9 | 19:05 | 16.8 | 18:40 |
Arizona | 7.1 | 19:35 | 11.1 | 18:50 |
Nevada | 2.9 | 19:40 | 3.9 | 18:50 |
Conclusion
Measuring the online traffic with news media outlets during the presidential and VP debates provided insights into how people consume their news during a major national event. The close race is driving people in large numbers to seek news of the 2024 election, viewing the debates live and obtaining news through online media publishers.
Here are a few insights when inspecting the data:
Aggregated traffic patterns with online news providers leading up to, during, and after the debates were similar across the entire U.S. and the seven battleground states.
Traffic spikes with the VP debates were higher nationally and with each battleground state. Turning to online news sources during the VP debate vs. live viewing could explain the higher peaks. Traffic in Pennsylvania and North Carolina stands out.
Aggregated traffic to the news sites was consistent with the state population size, except for Arizona and Nevada where peak traffic was proportionally lower. Could there have been overall less interest in the debates? Both of these states had strong peaks the day after the debates, possibly attributed to 9/11 news.
Additional Resources
The Definitive CDN Buyer’s Guide
Many CDNs offer the same types of services, but they're not all the same. Whether you're trying to improve your performance and security, or selecting a CDN to start with, use this guide to distinguish the best from the rest. Get a copy of the guide.
Streaming under Siege: Defending Online Media in a Growing Threat Landscape
With their valuable content, sensitive data, and wide reach, online broadcasters are prime targets for cyberattacks. Threats include DDoS attacks, credential stuffing, and piracy, often motivated by financial gain or political agendas. Read the report.
