As organizations push applications and workloads to the edge, having visibility into origin behavior - for example, the ability to monitor errors and real-time traffic exiting origins - becomes even more critical for ensuring uptime and analyzing traffic flows. The collection of aggregated metrics (such as per-origin bandwidth or requests) for a Fastly service can be immensely valuable. For example, the metrics can also help indicate configuration issues across multiple origins or multi-cloud deployments, or when unexpected issues arise from a newly deployed application or during a live event.
With this in mind, we are pleased to announce that Origin Inspector, Fastly’s turnkey origin visibility product, is now available to Compute customers. With this release, our customers can obtain deep origin visibility metrics including the ability to pinpoint origin errors, study performance issues, and spend less time troubleshooting regardless of whether they employ single-origin, or multi-cloud architectures. Origin Inspector simplifies operations across our entire platform by facilitating the real-time monitoring of origin responses, bytes, status codes, and latency without the cost and complexity involved with having to send log data to a third-party tool.
“Using Origin Inspector to monitor real-time egress traffic and errors at the per-origin level hugely simplified our origin visibility — and we were able to connect it to our existing alerting solution.”
- Ryan Townsend, Co-Founder & CTO at SHIFT Commerce
Along with our Compute customers, we have also heard and prioritized customer requests for Origin Inspector metrics when using Next-Gen WAF with VCL services. Fastly’s Next-Gen WAF is built on Compute and this key integration is already powering new capabilities to get Origin Inspector metrics for WAF traffic. With security and visibility tied together, origin behavior information helps provide insights, allowing customers to make changes or updates to Next-Gen WAF rules. Customers benefit from unified origin observability all built into the Fastly App.
Origin Inspector offers the ability to:
Get visibility from origin to edge so you can report and react in real-time to changes in origin behavior.
Monitor and report on egress data within the Fastly UI without needing to set up complex data pipelines.
Access both real-time and historical data to help troubleshoot errors and improve origin performance.
How it works
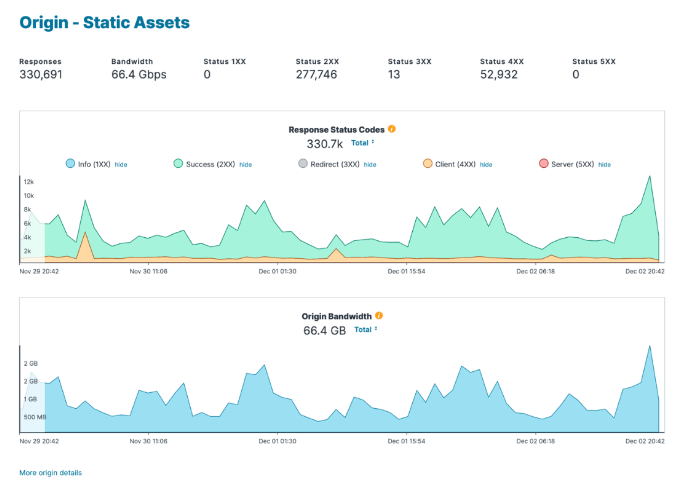
Origin Inspector builds on our existing Observability interface by providing real-time and historic visibility into detailed response data for origin traffic sent through Fastly. Customers get both origin summary and detailed dashboards. Customers can also self-enable Origin Inspector directly from their Compute service through the Fastly UI.

Figure 1: Origin dashboard example
Common Use Cases:
Origin monitoring: Proactively monitor and react in a timely manner to issues that arise at the origin.
Event monitoring: Get end-to-end visibility of traffic to your origin during critical calendar and live events.
Troubleshoot origin errors: Account for every origin response, origin byte, and status code to get insight into origin errors and failures.
Learn more about Origin Inspector or try it today for your C@E service with a 30-day free trial. You can self-enable the trial. Or just reach out to sales@fastly.com.

