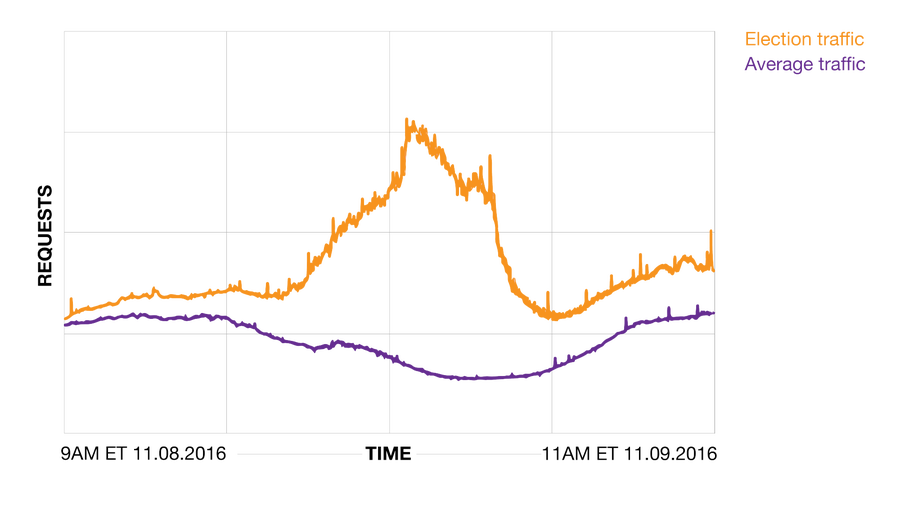
Although online engagement increases with every election, the 2016 presidential election saw a particularly dramatic boost. As surprising polling results rolled in across the nation, voters and global observers turned to trusted media sites to follow the politically polarizing race. On November 8, 2016, Vox Media’s Election Day emotion tracker showed that many readers were on edge – “anxious” was the most common emotion submitted to Vox, and media traffic surged into the early morning hours as the election came to a close.
Over 75 million global tweets were sent related to the 2016 election, and traffic remained high throughout the day – we saw a sustained increase in traffic for media sites with real-time election coverage, with traffic to these sites surging 9x higher than average weekly traffic. We also served a record 5 million requests per second as the world went online to monitor the election.
NYtimes.com election traffic trends
The New York Times removed their paywall for 72 hours from 12:01 AM ET on Monday, November 7 until 11:59 PM ET on Wednesday, November 9 so readers could freely consult the news site for live election coverage and a real-time election map. Nytimes.com is behind Fastly, and we were able to observe some traffic trends during this period.

We'd like to extend a special thank you to the New York Times, who graciously allowed us to share the nytimes.com traffic trends we observed for November 8-9, 2016:
9 PM ET: Traffic increased 2,863.5% as compared to average weekly traffic as polls in Arizona, Michigan, New York, Texas, and Colorado closed.
10:15 PM ET: a 5,009% increase as polls closed in Utah, Nevada, and Iowa.
12 AM ET: a 7,560% increase as results for Florida were called for Trump.
2 AM ET: an 8,371% increase as Pennsylvania went to Trump and readers stayed up late to engage with final results.
Top media moments from election day:
Fastly powers tens of thousands of websites, including top publishers and social media platforms like BuzzFeed, Vox Media, Twitter, Wenner Media, and Condé Nast, giving us key insights into how users react online — the following represents aggregated traffic patterns we saw on election day.
On a normal day, media traffic normally drops off around 1 AM ET as readers shut off screens to go to bed; aggregated media traffic on election night was 350% above average as viewers flocked online to check on election results and impact to the market.

Here’s a timeline of the media traffic trends we observed on November 8-9, 2016:
8 PM ET: polls closed in the battleground states of Pennsylvania, Florida, and New Hampshire, and media sites saw an 118% increase in traffic as compared to normal.
9:00 PM ET: 140.5% increase in media traffic as compared to normal as polls in Arizona. Michigan, New York, Texas, and Colorado closed.
10:00 PM ET: 183% increase in media traffic as polls closed in key battleground states Iowa and Nevada, as well as in Utah and Montana.
11:00 PM ET: 356.4% increase in media traffic as results from 48 states (including California) comes in, and a winner is projected.
2:00 AM ET: 365% increase in media traffic as reports flood in about the S&P 500 slumping.
2:40 AM ET: 325% increase in media traffic as Clinton makes concession call and Trump’s speech commences.
Introducing Fastly real-time insights
Our unique position as a CDN gives us the ability to gather and report on user engagement as events occur. You can visit our real-time insights microsite for a look into traffic patterns during major events, such as breaking news stories, ecommerce events (like Black Friday), and the Super Bowl.
